Learn Quarto

Author

1 Bivariate graphs

Bivariate graphs display the relationship between two variables. The type of graph will depend on the measurement level of the variables (categorical or quantitative).

1.1 Categorical vs. Categorical graphs

When plotting the relationship between two categorical variables, stacked, grouped, or segmented bar charts are typically used. A less common approach is the mosaic chart.

Example

The mpg dataset from the ggplot2 package, contains fuel economy data for 38 popular models of car, for the years 1999 and 2008. Plot the relationship between automobile class and drive type (front-wheel, rear-wheel, or 4-wheel drive) for the automobiles.

1.1.1 Access data

Code
library(ggplot2)
data(mpg, package="ggplot2")
library(dplyr)
head(mpg)
# A tibble: 6 x 11
  manufacturer model displ  year   cyl trans      drv     cty   hwy fl    class 
  <chr>        <chr> <dbl> <int> <int> <chr>      <chr> <int> <int> <chr> <chr> 
1 audi         a4      1.8  1999     4 auto(l5)   f        18    29 p     compa~
2 audi         a4      1.8  1999     4 manual(m5) f        21    29 p     compa~
3 audi         a4      2    2008     4 manual(m6) f        20    31 p     compa~
4 audi         a4      2    2008     4 auto(av)   f        21    30 p     compa~
5 audi         a4      2.8  1999     6 auto(l5)   f        16    26 p     compa~
6 audi         a4      2.8  1999     6 manual(m5) f        18    26 p     compa~
Code
glimpse(mpg)
Rows: 234
Columns: 11
$ manufacturer <chr> "audi", "audi", "audi", "audi", "audi", "audi", "audi", "~
$ model        <chr> "a4", "a4", "a4", "a4", "a4", "a4", "a4", "a4 quattro", "~
$ displ        <dbl> 1.8, 1.8, 2.0, 2.0, 2.8, 2.8, 3.1, 1.8, 1.8, 2.0, 2.0, 2.~
$ year         <int> 1999, 1999, 2008, 2008, 1999, 1999, 2008, 1999, 1999, 200~
$ cyl          <int> 4, 4, 4, 4, 6, 6, 6, 4, 4, 4, 4, 6, 6, 6, 6, 6, 6, 8, 8, ~
$ trans        <chr> "auto(l5)", "manual(m5)", "manual(m6)", "auto(av)", "auto~
$ drv          <chr> "f", "f", "f", "f", "f", "f", "f", "4", "4", "4", "4", "4~
$ cty          <int> 18, 21, 20, 21, 16, 18, 18, 18, 16, 20, 19, 15, 17, 17, 1~
$ hwy          <int> 29, 29, 31, 30, 26, 26, 27, 26, 25, 28, 27, 25, 25, 25, 2~
$ fl           <chr> "p", "p", "p", "p", "p", "p", "p", "p", "p", "p", "p", "p~
$ class        <chr> "compact", "compact", "compact", "compact", "compact", "c~
Code
summary(mpg)
 manufacturer          model               displ            year     
 Length:234         Length:234         Min.   :1.600   Min.   :1999  
 Class :character   Class :character   1st Qu.:2.400   1st Qu.:1999  
 Mode  :character   Mode  :character   Median :3.300   Median :2004  
                                       Mean   :3.472   Mean   :2004  
                                       3rd Qu.:4.600   3rd Qu.:2008  
                                       Max.   :7.000   Max.   :2008  
      cyl           trans               drv                 cty       
 Min.   :4.000   Length:234         Length:234         Min.   : 9.00  
 1st Qu.:4.000   Class :character   Class :character   1st Qu.:14.00  
 Median :6.000   Mode  :character   Mode  :character   Median :17.00  
 Mean   :5.889                                         Mean   :16.86  
 3rd Qu.:8.000                                         3rd Qu.:19.00  
 Max.   :8.000                                         Max.   :35.00  
      hwy             fl               class          
 Min.   :12.00   Length:234         Length:234        
 1st Qu.:18.00   Class :character   Class :character  
 Median :24.00   Mode  :character   Mode  :character  
 Mean   :23.44                                        
 3rd Qu.:27.00                                        
 Max.   :44.00                                        
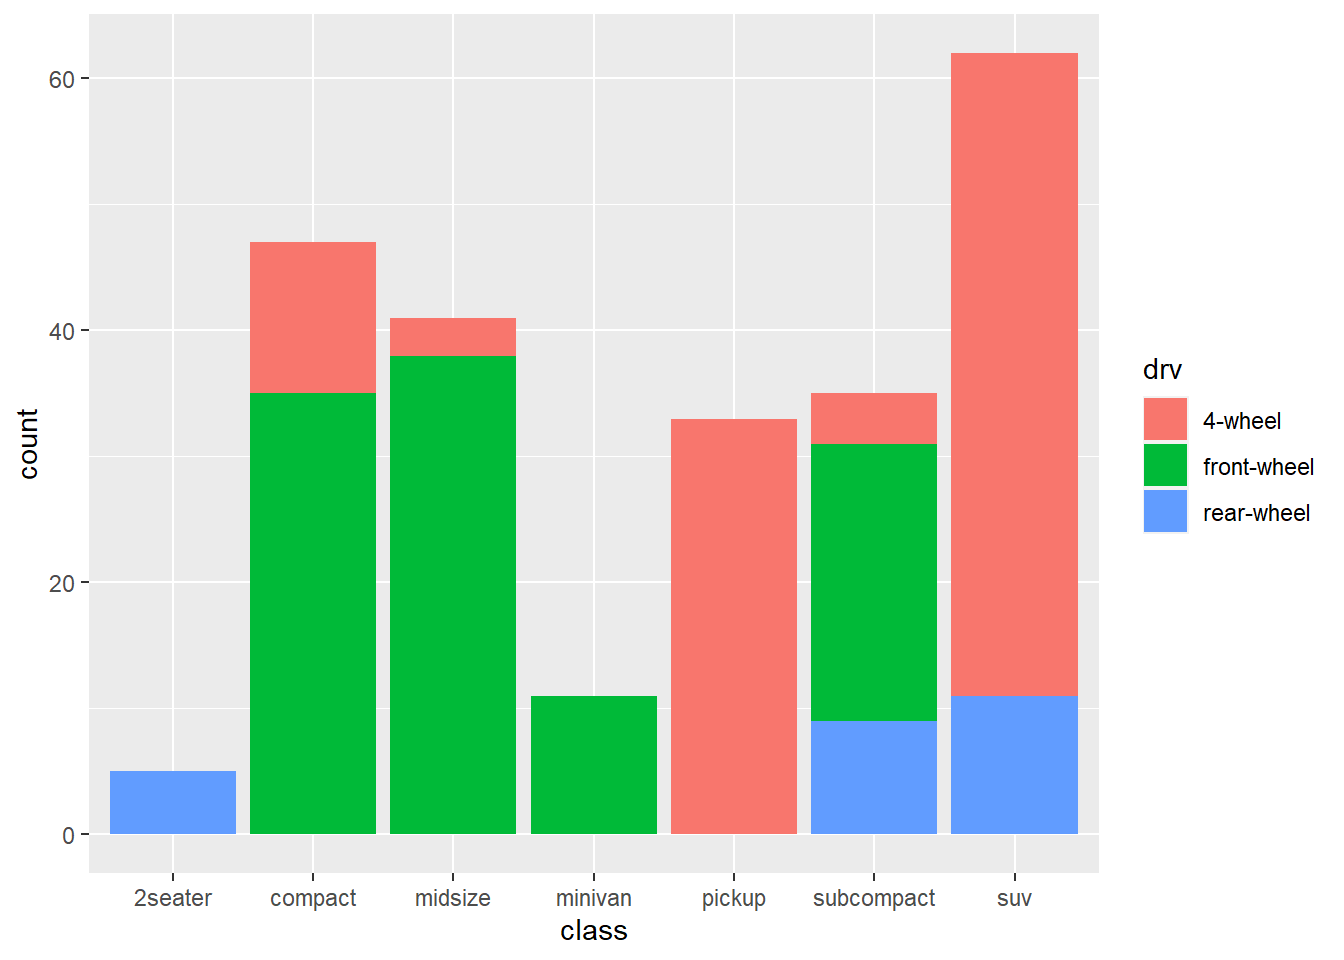
Now, we plot the relationship between automobile class and drive type (front-wheel, rear-wheel, or 4-wheel drive) for the automobiles using stacked, or segmented bar charts.

1.1.2 Stacked bar chart

Code
library(ggplot2)
ggplot(mpg, 
       aes(x = class, 
           fill = drv)) + 
  geom_bar(position = "stack")+
  scale_fill_discrete(labels = c("4-wheel", "front-wheel", "rear-wheel"))

According to the Figure 1, the most common vehicle is the SUV. All 2seater cars are rear wheel drive, and most of the SUVs are 4-wheel drive. All minivans are front wheel drive, and all pickups are four wheel.

1.1.3 Segmented bar plot

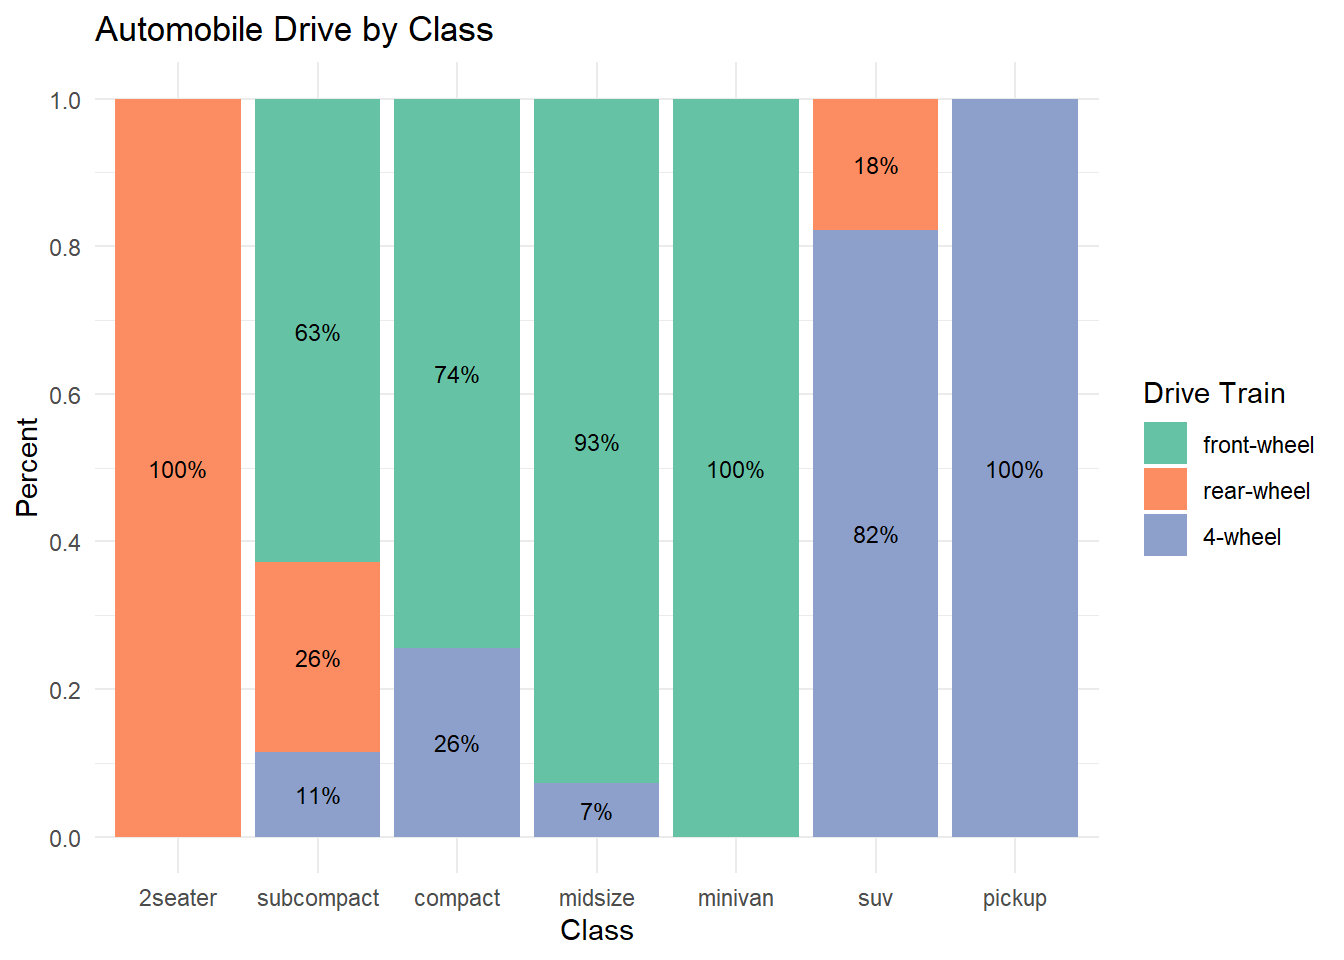
This is also a stacked bar plot where each bar represents 100 percent.

Code
library(dplyr)
plotdata <- mpg %>%
  group_by(class, drv) %>%
  summarize(n = n()) %>% 
  mutate(pct = n/sum(n),
         lbl = scales::percent(pct))
`summarise()` has grouped output by 'class'. You can override using the
`.groups` argument.
Code
ggplot(plotdata, 
       aes(x = factor(class,
                      levels = c("2seater", "subcompact", 
                                 "compact", "midsize", 
                                 "minivan", "suv", "pickup")),
           y = pct,
           fill = factor(drv, 
                         levels = c("f", "r", "4"),
                         labels = c("front-wheel", 
                                    "rear-wheel", 
                                    "4-wheel")))) + 
geom_bar(stat = "identity",
           position = "fill") +
  scale_y_continuous(breaks = seq(0, 1, .2)) +
  geom_text(aes(label = lbl), 
            size = 3, 
            position = position_stack(vjust = 0.5)) +
  scale_fill_brewer(palette = "Set2") +
  labs(y = "Percent", 
       fill = "Drive Train",
       x = "Class",
       title = "Automobile Drive by Class") +
  theme_minimal()

You can easily change the options shown in the above Figure 2.

References